글
[시스템트레이딩] Super Trend
TradingView에서 인기 높은 지표 중의 하나가 Super Trend입니다. 추세의 시작 시점과 끝을 알려주는 지표로 많은 사랑을 받고 있습니다.
https://www.tradingview.com/v/r6dAP7yi/
SuperTrend — KivancOzbilgic tarafından gösterge
SuperTrend is one of the most common ATR based trailing stop indicators. In this version you can change the ATR calculation method from the settings. Default method is RMA, when the alternative method is SMA. The indicator is easy to use and gives an accur
tr.tradingview.com
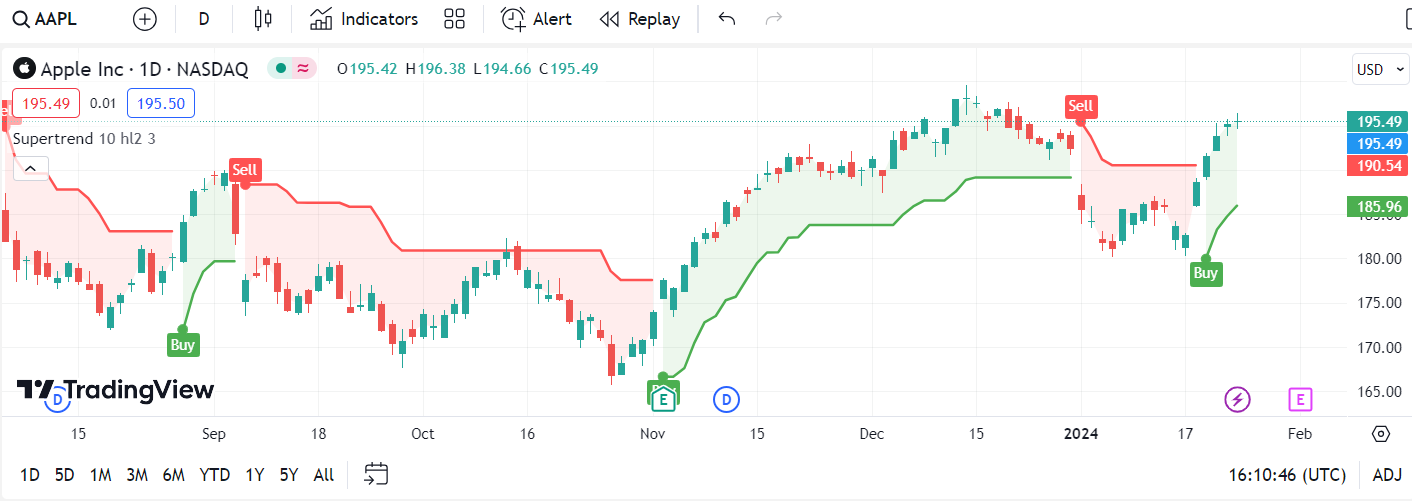
Apple 차트에 대한 SuperTrend signal입니다. Apple이 추세를 잘 그리는 종목이라 진입 시점이 잘 맞는 것 같습니다.
SuperTrend의 pine script는 아래와 같습니다.
https://www.tradingview.com/v/r6dAP7yi/
//@version=4
study("Supertrend", overlay = true, format=format.price, precision=2, resolution="")

Periods = input(title="ATR Period", type=input.integer, defval=10)
src = input(hl2, title="Source")
Multiplier = input(title="ATR Multiplier", type=input.float, step=0.1, defval=3.0)
changeATR= input(title="Change ATR Calculation Method ?", type=input.bool, defval=true)
showsignals = input(title="Show Buy/Sell Signals ?", type=input.bool, defval=true)
highlighting = input(title="Highlighter On/Off ?", type=input.bool, defval=true)

atr2 = sma(tr, Periods)
atr= changeATR ? atr(Periods) : atr2
up=src-(Multiplier*atr)
up1 = nz(up[1],up)
up := close[1] > up1 ? max(up,up1) : up
dn=src+(Multiplier*atr)
dn1 = nz(dn[1], dn)
dn := close[1] < dn1 ? min(dn, dn1) : dn
trend = 1
trend := nz(trend[1], trend)
trend := trend == -1 and close > dn1 ? 1 : trend == 1 and close < up1 ? -1 : trend

upPlot = plot(trend == 1 ? up : na, title="Up Trend", style=plot.style_linebr, linewidth=2, color=color.green)
buySignal = trend == 1 and trend[1] == -1

plotshape(buySignal ? up : na, title="UpTrend Begins", location=location.absolute, style=shape.circle, size=size.tiny, color=color.green, transp=0)
plotshape(buySignal and showsignals ? up : na, title="Buy", text="Buy", location=location.absolute, style=shape.labelup, size=size.tiny, color=color.green, textcolor=color.white, transp=0)
dnPlot = plot(trend == 1 ? na : dn, title="Down Trend", style=plot.style_linebr, linewidth=2, color=color.red)
sellSignal = trend == -1 and trend[1] == 1
plotshape(sellSignal ? dn : na, title="DownTrend Begins", location=location.absolute, style=shape.circle, size=size.tiny, color=color.red, transp=0)
plotshape(sellSignal and showsignals ? dn : na, title="Sell", text="Sell", location=location.absolute, style=shape.labeldown, size=size.tiny, color=color.red, textcolor=color.white, transp=0)
mPlot = plot(ohlc4, title="", style=plot.style_circles, linewidth=0)
longFillColor = highlighting ? (trend == 1 ? color.green : color.white) : color.white
shortFillColor = highlighting ? (trend == -1 ? color.red : color.white) : color.white
fill(mPlot, upPlot, title="UpTrend Highligter", color=longFillColor)
fill(mPlot, dnPlot, title="DownTrend Highligter", color=shortFillColor)
alertcondition(buySignal, title="SuperTrend Buy", message="SuperTrend Buy!")
alertcondition(sellSignal, title="SuperTrend Sell", message="SuperTrend Sell!")
changeCond = trend != trend[1]
alertcondition(changeCond, title="SuperTrend Direction Change", message="SuperTrend has changed direction!")
TradingView를 사용한다면 SuperTrend를 바로 사용할 수 있지만 본인이 직접 자동매매를 하는 경우에는 pine script를 본인이 사용하는 컴퓨터 언어로 변환작업을 해야합니다.
이에 SuperTrend 지표를 python으로 변환하는 과정을 정리하고자 합니다.
다음 편에서는 SuperTrend 지표를 만드는 방법에 대하여 정리하면서 해당하는 python code를 함께 정리하도록 하겠습니다.
'시스템트레이딩' 카테고리의 다른 글
| [시스템트레이딩] 옵션 시스템트레이딩시 필요한 데이터 (0) | 2024.03.12 |
|---|---|
| [시스템트레이딩] 옵션 Naked 매수/매도(1) (2) | 2023.11.24 |
| 예스트레이더(YesTrader) 예제 (1) | 2023.10.20 |
| [시스템트레이딩] 수익나는 옵션 매도 전략(8) (1) | 2023.05.19 |
| [시스템트레이딩] 수익나는 옵션 매도 전략(7) (0) | 2023.05.02 |
