검색결과 리스트
파이썬에 해당되는 글 4건
- 2024.01.25 [시스템트레이딩] Super Trend
- 2022.05.30 [파이썬] 유용한 package들
- 2022.05.11 [파이썬] 출력 text에 컬러 입히기
- 2020.02.24 파이썬을 이용한 업비트 시세 데이터 받기(1)
글
[시스템트레이딩] Super Trend
TradingView에서 인기 높은 지표 중의 하나가 Super Trend입니다. 추세의 시작 시점과 끝을 알려주는 지표로 많은 사랑을 받고 있습니다.
https://www.tradingview.com/v/r6dAP7yi/
SuperTrend — KivancOzbilgic tarafından gösterge
SuperTrend is one of the most common ATR based trailing stop indicators. In this version you can change the ATR calculation method from the settings. Default method is RMA, when the alternative method is SMA. The indicator is easy to use and gives an accur
tr.tradingview.com
Apple 차트에 대한 SuperTrend signal입니다. Apple이 추세를 잘 그리는 종목이라 진입 시점이 잘 맞는 것 같습니다.

SuperTrend의 pine script는 아래와 같습니다.
https://www.tradingview.com/v/r6dAP7yi/
//@version=4
study("Supertrend", overlay = true, format=format.price, precision=2, resolution="")

Periods = input(title="ATR Period", type=input.integer, defval=10)
src = input(hl2, title="Source")
Multiplier = input(title="ATR Multiplier", type=input.float, step=0.1, defval=3.0)
changeATR= input(title="Change ATR Calculation Method ?", type=input.bool, defval=true)
showsignals = input(title="Show Buy/Sell Signals ?", type=input.bool, defval=true)
highlighting = input(title="Highlighter On/Off ?", type=input.bool, defval=true)

atr2 = sma(tr, Periods)
atr= changeATR ? atr(Periods) : atr2
up=src-(Multiplier*atr)
up1 = nz(up[1],up)
up := close[1] > up1 ? max(up,up1) : up
dn=src+(Multiplier*atr)
dn1 = nz(dn[1], dn)
dn := close[1] < dn1 ? min(dn, dn1) : dn
trend = 1
trend := nz(trend[1], trend)
trend := trend == -1 and close > dn1 ? 1 : trend == 1 and close < up1 ? -1 : trend

upPlot = plot(trend == 1 ? up : na, title="Up Trend", style=plot.style_linebr, linewidth=2, color=color.green)
buySignal = trend == 1 and trend[1] == -1

plotshape(buySignal ? up : na, title="UpTrend Begins", location=location.absolute, style=shape.circle, size=size.tiny, color=color.green, transp=0)
plotshape(buySignal and showsignals ? up : na, title="Buy", text="Buy", location=location.absolute, style=shape.labelup, size=size.tiny, color=color.green, textcolor=color.white, transp=0)
dnPlot = plot(trend == 1 ? na : dn, title="Down Trend", style=plot.style_linebr, linewidth=2, color=color.red)
sellSignal = trend == -1 and trend[1] == 1
plotshape(sellSignal ? dn : na, title="DownTrend Begins", location=location.absolute, style=shape.circle, size=size.tiny, color=color.red, transp=0)
plotshape(sellSignal and showsignals ? dn : na, title="Sell", text="Sell", location=location.absolute, style=shape.labeldown, size=size.tiny, color=color.red, textcolor=color.white, transp=0)
mPlot = plot(ohlc4, title="", style=plot.style_circles, linewidth=0)
longFillColor = highlighting ? (trend == 1 ? color.green : color.white) : color.white
shortFillColor = highlighting ? (trend == -1 ? color.red : color.white) : color.white
fill(mPlot, upPlot, title="UpTrend Highligter", color=longFillColor)
fill(mPlot, dnPlot, title="DownTrend Highligter", color=shortFillColor)
alertcondition(buySignal, title="SuperTrend Buy", message="SuperTrend Buy!")
alertcondition(sellSignal, title="SuperTrend Sell", message="SuperTrend Sell!")
changeCond = trend != trend[1]
alertcondition(changeCond, title="SuperTrend Direction Change", message="SuperTrend has changed direction!")
TradingView를 사용한다면 SuperTrend를 바로 사용할 수 있지만 본인이 직접 자동매매를 하는 경우에는 pine script를 본인이 사용하는 컴퓨터 언어로 변환작업을 해야합니다.
이에 SuperTrend 지표를 python으로 변환하는 과정을 정리하고자 합니다.
다음 편에서는 SuperTrend 지표를 만드는 방법에 대하여 정리하면서 해당하는 python code를 함께 정리하도록 하겠습니다.
'시스템트레이딩' 카테고리의 다른 글
| [시스템트레이딩] 옵션 시스템트레이딩시 필요한 데이터 (0) | 2024.03.12 |
|---|---|
| [시스템트레이딩] 옵션 Naked 매수/매도(1) (2) | 2023.11.24 |
| 예스트레이더(YesTrader) 예제 (1) | 2023.10.20 |
| [시스템트레이딩] 수익나는 옵션 매도 전략(8) (1) | 2023.05.19 |
| [시스템트레이딩] 수익나는 옵션 매도 전략(7) (0) | 2023.05.02 |
글
[파이썬] 유용한 package들
파이썬을 이용하여 app 개발할 때 유용한 package입니다.
1. pprint
dict, list 등 자료 구조에 있는 데이터를 구조에 맞쳐 출력을 해 줍니다.
<설치>
pip install pprint
<사용법>
from pprint import pprint
pprint(변수명)
<예제>
from pprint import pprint
cur_price = {
    'market':	"KRW-BTC",
    'trade_date':	"20220530",
    'trade_time':	"083351",
    'trade_date_kst':	"20220530",
    'trade_time_kst':	"173351",
    'trade_timestamp':	1653899631000,
    'opening_price':	37415000,
    'high_price':	38666000,
    'low_price':	37230000,
    'trade_price':	38475000,
    'prev_closing_price':	37380000,
    'change':	"RISE"
}
print(cur_price)
print('')
pprint(cur_price)
<실행결과>

2. log
프로그램 개발 중 저장할 내용을 기록할 수 있습니다.
<설치>
pip install logging
<사용법>
import time
import logging
# log 용 파일 정의하고 설정
log_name = '.\\test.log'
logging.basicConfig(filename=log_name, level=logging.INFO)
# 로깅이 필요한 곳에서 아래 함수 호출
logging.info(문자열)
<예제>
저장할 필요가 있는 곳에서 아래 함수를 부른다. 단 인자는 string 형태로 변경해 주어야 한다. 항목 마다 ,를 넣어서 향후 excel에서 csv 형태로 읽을 수 있도록 한다.
위 upbit거래소의 BTC 현재가 중 현재시간과 BTC 그리고 현재가를 저장하는 예제
cur = time.strftime("%Y%m%d") # 현재 시간
ss = cur + ',' + cur_price['market'] + ',' + str(cur_price['trade_price']) # 현재시간,krw-btc,현재가
logging.info(ss) # 저장
<결과>
파일에 저장된 결과입니다.

3. colored text
GUI를 이용하여 개발하기에는 시간이 많이 소요되므로 일반적으로 text용 terminal을 이용합니다. 이때 중요한 문자열에 서로 다른 색으로 표출할 수 있다면 가독성이 올라갑니다.
<설치>
pip install termcolor
<사용법>
from termcolor import colored
colored() 함수를 이용하여 원하는 색이 입혀진 text를 받은 후 출력
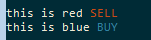
<예제>
from termcolor import colored

data = 'SELL'
s = colored(data, 'red')
print('this is red', s)

data = 'BUY'
s = colored(data, 'cyan')
print('this is blue', s)
<실행결과>
'파이썬' 카테고리의 다른 글
| [파이썬] 파이썬을 이용하여 간단하게 GUI 만드는 방법[1] : tkinter (2) | 2022.11.08 |
|---|---|
| [파이썬] 간단한 프로그램 watchdog 만들기 (0) | 2022.08.02 |
| [파이썬] 출력 text에 컬러 입히기 (0) | 2022.05.11 |
| [파이썬] 실행 시 환경 변수 읽기 쓰기 (1) | 2022.01.17 |
| [파이썬] 파이썬을 이용하여 날짜/시간 다루기 (0) | 2022.01.14 |
글
[파이썬] 출력 text에 컬러 입히기
파이썬 프로그램으로 프로그램을 개발하는 경우에는 cmd 창에 관련 메세지를 출력하는 경우가 많습니다.
이때 출력되는 text에 컬러를 입힐 수 있다면 가독성이 올라갈 수 있습니다.
관련 글들을 찾아보니 간단하게 아스키 문자열을 추가하면 원하는 color로 변경할 수 있습니다.
우선 기본 컬러를 정의한 후
BRIGHT_BLACK = '\033[90m'
BRIGHT_RED = '\033[91m'
BRIGHT_GREEN = '\033[92m'
BRIGHT_YELLOW = '\033[93m'
BRIGHT_BLUE = '\033[94m'
BRIGHT_MAGENTA = '\033[95m'
BRIGHT_CYAN = '\033[96m'
BRIGHT_WHITE = '\033[97m'
BRIGHT_END = '\033[0m'
print 문에 아래와 같이 함께 출력하면 됩니다.
print(BRIGHT_RED + 'TEST' + BRIGHT_END)결과는 아래와 같습니다.
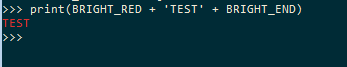
출력 문자열 중 컬러를 변경하고 싶은 경우에는 앞에 색깔, 뒤에 END를 추가하면 됩니다.
조금 귀찮긴 하지만 간단하게 컬러 문자를 출력할 수 있군요.
함수로 만들어 쓰면 좋을 듯 합니다.
아래 글 참고했습니다.
'파이썬' 카테고리의 다른 글
| [파이썬] 간단한 프로그램 watchdog 만들기 (0) | 2022.08.02 |
|---|---|
| [파이썬] 유용한 package들 (0) | 2022.05.30 |
| [파이썬] 실행 시 환경 변수 읽기 쓰기 (1) | 2022.01.17 |
| [파이썬] 파이썬을 이용하여 날짜/시간 다루기 (0) | 2022.01.14 |
| [파이썬] 시간 다루기 (1) | 2020.12.27 |
글
파이썬을 이용한 업비트 시세 데이터 받기(1)
upbit에서 거래가 되고 있는 암호화폐들의 시세를 얻을 수 있는 방법입니다.
아래 예는 upbit에서 거래 중인 EOS의 30분 데이터를 100개 가져오는 것입니다.
https://crix-api-endpoint.upbit.com/v1/crix/candles/minutes/30?code=CRIX.UPBIT.KRW-EOS&count=100
그 결과는 json 형태로 오는데요. FireFox에서 접속해보면 json형태를 시각적으로 잘 볼 수 있도록 보여줍니다.
분/일/주/월 데이터를 가져오는 방법입니다.
- minutes/1 # 1분 데이터
- minutes/30 # 30분 데이터
- days # 일봉
- weeks # 주봉
- months # 월봉
파이썬과 같은 프로그래밍 언어를 안다면 더 쉽게 원하는 데이터를 뽑을 수 있겠죠. 다음 시간에는 파이썬으로 원하는 데이터를 추출하는 방법에 대하여 알아보겠습니다.
'암호화폐 거래소 API' 카테고리의 다른 글
| [암호화폐] WebSocket을 이용하여 upbit에서 실시간 거래내역 받기 (24) | 2020.11.03 |
|---|
